Refugees in Canada
A glimpse into the lives and achievements of the one million refugees who arrived in Canada since 1980.
Photo: © UNHCR/Chris Young
Most refugees came to Canada with few, if any, financial resources, and often had to learn a new language and adapt to a new culture. Despite these challenges, the results show that refugees do not simply benefit from the safety Canada gives them. In fact, they embrace the opportunity that Canada provides to build a better life and become important contributors to the country’s economy and cultural diversity.
Canada has a strong tradition of welcoming refugees
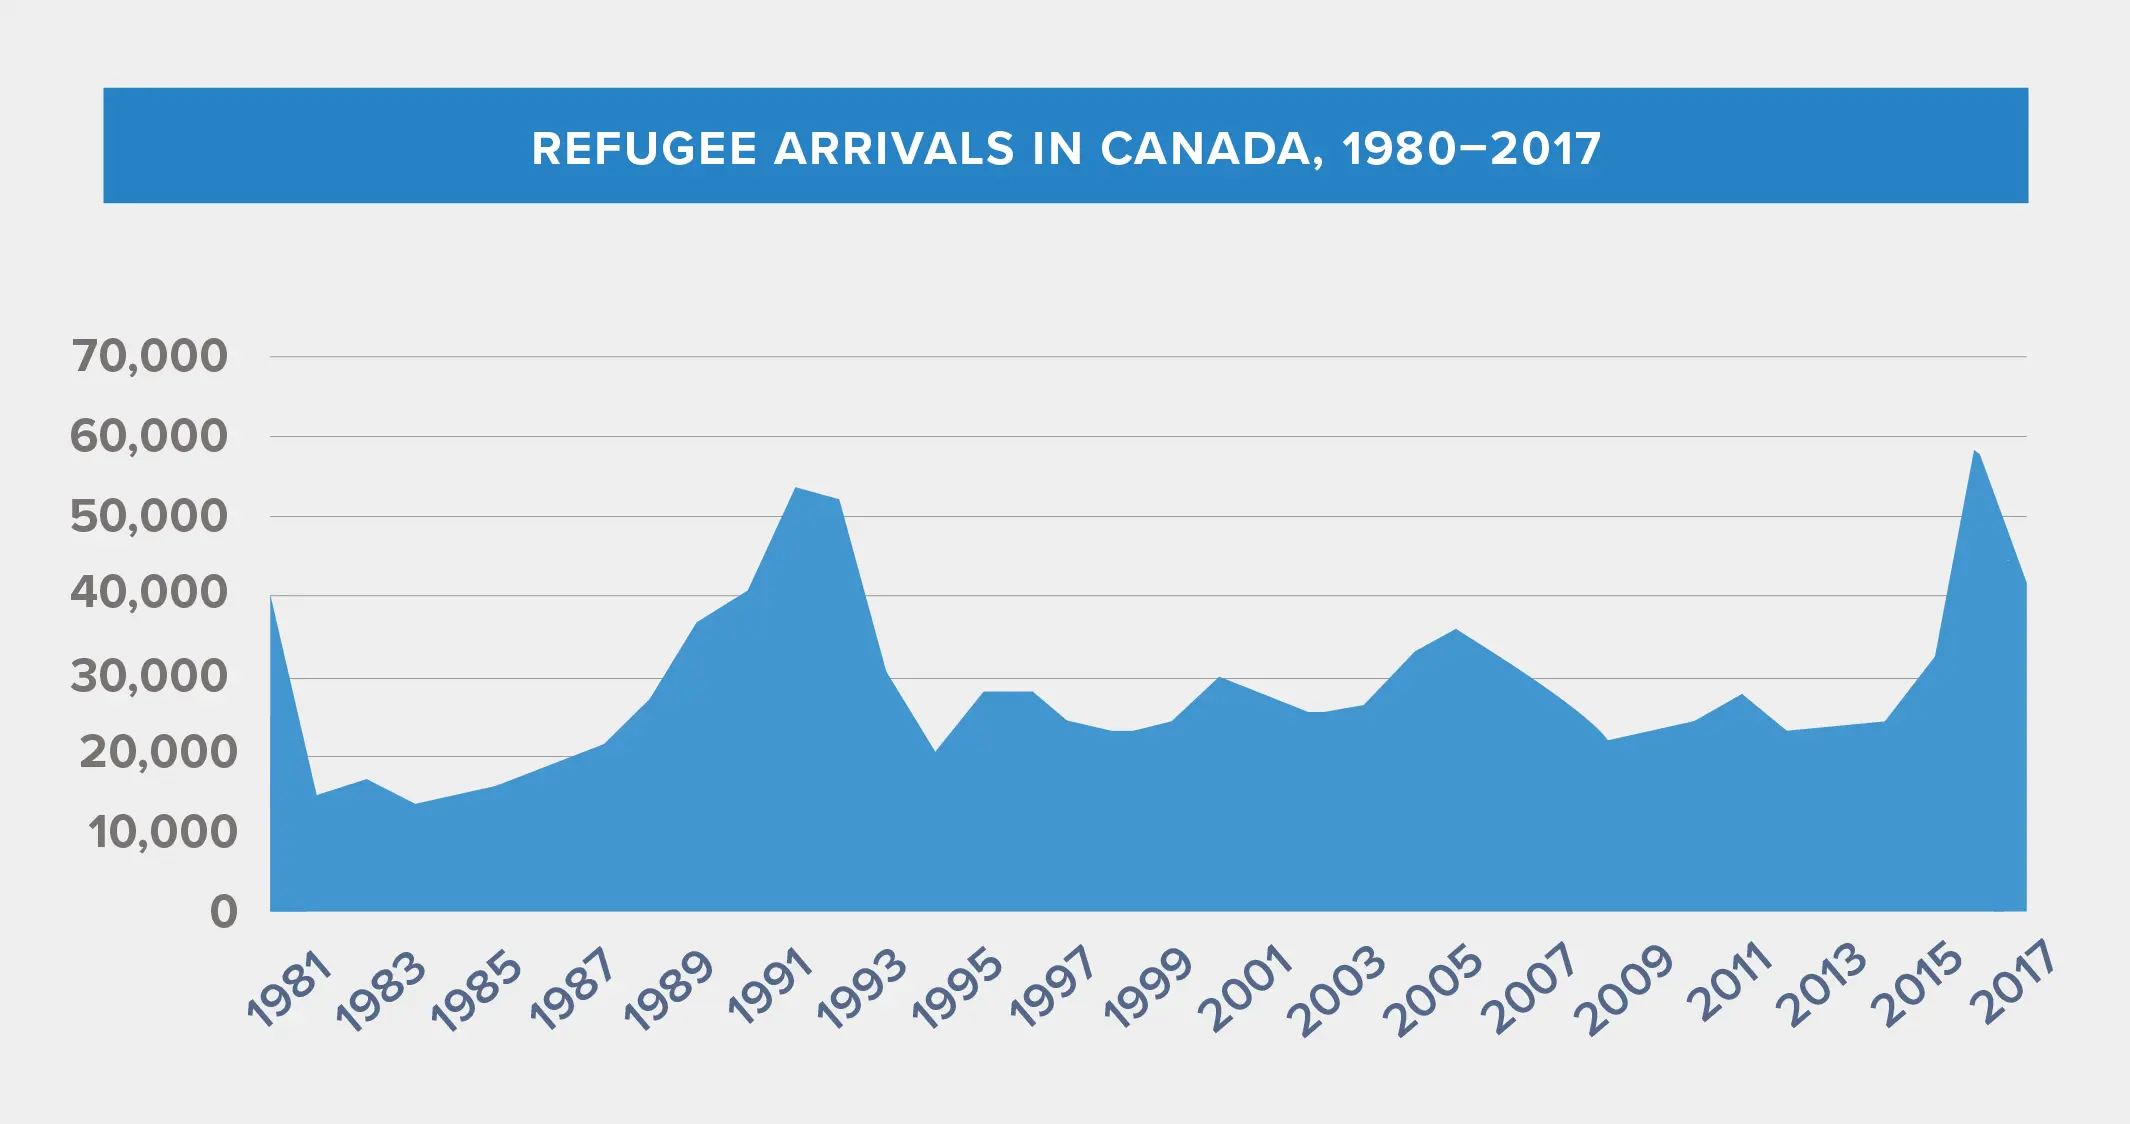
Canada has welcomed 1,088,015 refugees since 1980. This number includes those who were recognized as refugees in Canada or who were resettled from overseas.
Unemployment rate
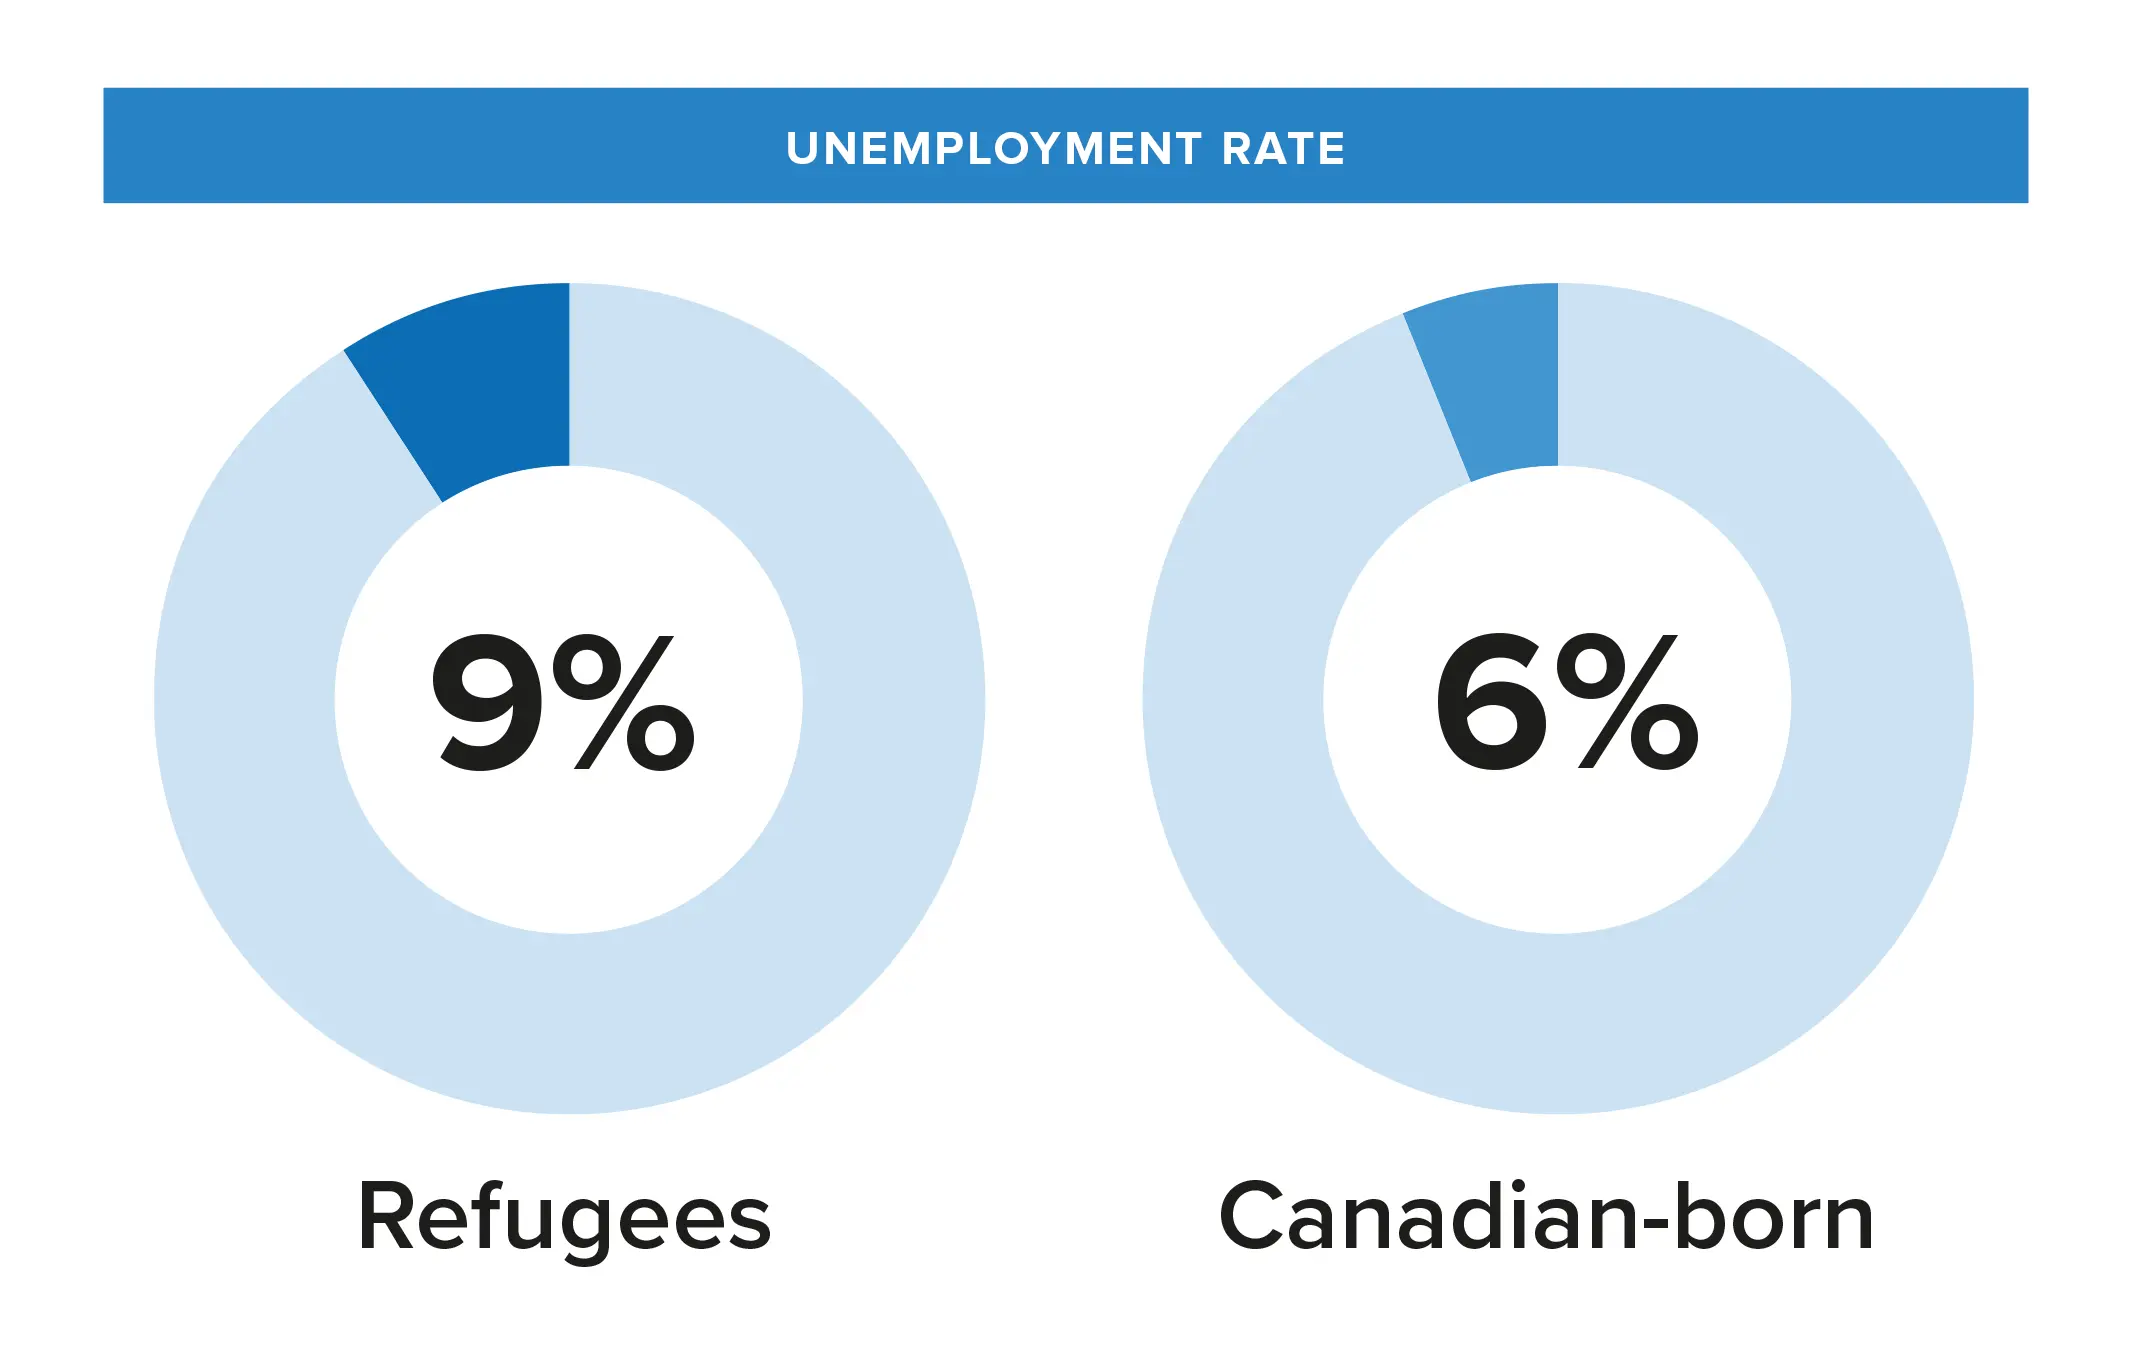
Refugees have almost the same unemployment rate as Canadians. They contribute to this country’s economy and are not a burden on Canadian taxpayers as few are unemployed. The unemployment rate for refugees aged 25 to 54 is 9%, close to that of Canadian-born citizens (6%). The situation for refugees improves as they spend more time in Canada. Refugees who arrived in Canada between 1981 and 1990 have an unemployment rate of 6%, identical to those born in Canada.
Income
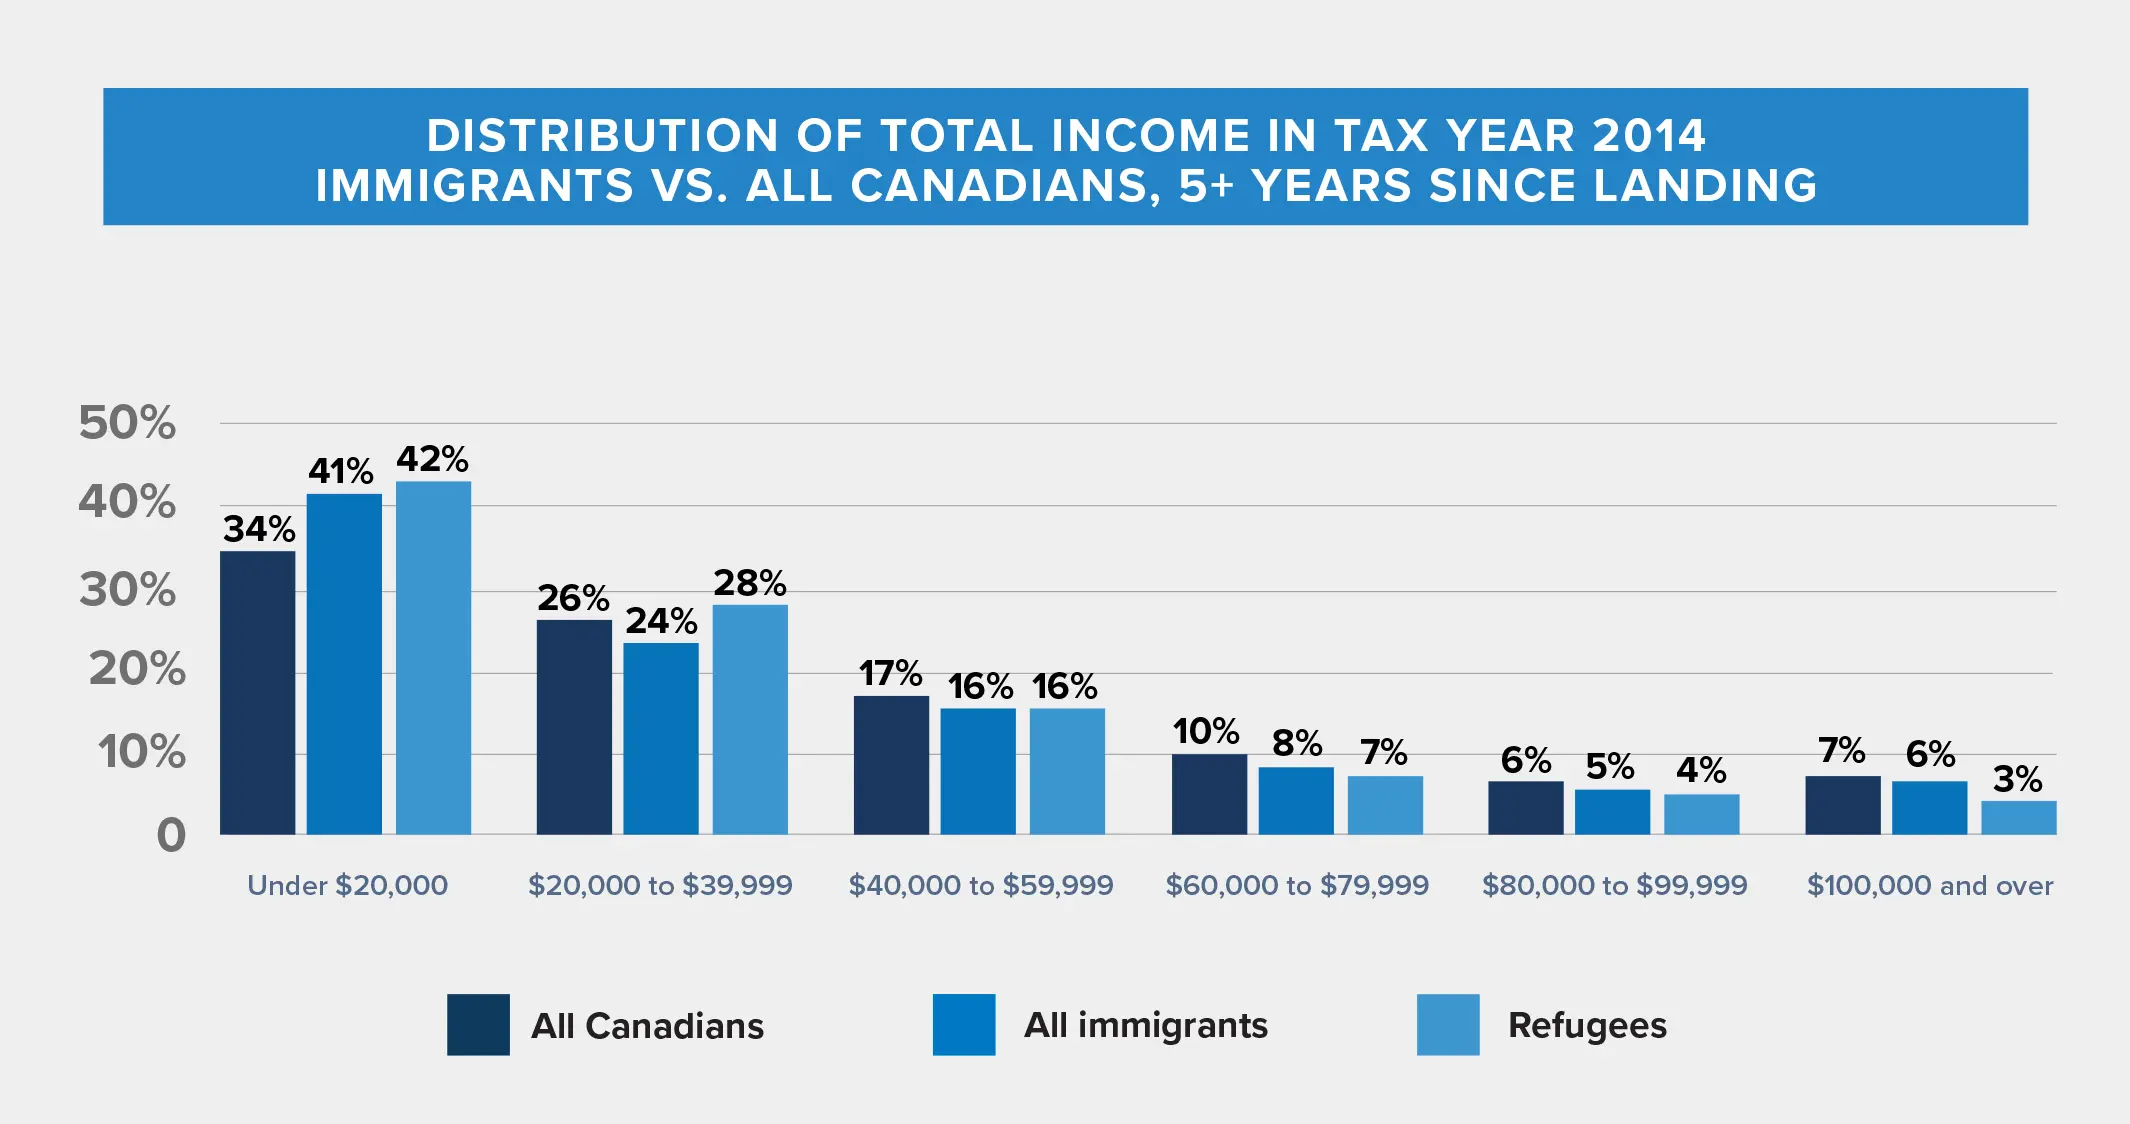
Refugees prosper and join Canada’s middle-class within five years of their arrival. Refugees who arrived as adults earn on average $20,000 in employment income in their first year. While this is less than half the Canadian average, their annual earnings climb steadily. Data from the 2014 tax year show that a significant proportion of refugees who have been in Canada for at least five years earn middle-class incomes. Nearly one in four refugees (23%) earned between $40,000 and $79,999 annually, similar to the percentage of Canadians (27%) and total immigrants (24%) earning a middle-class income.
Paying taxes
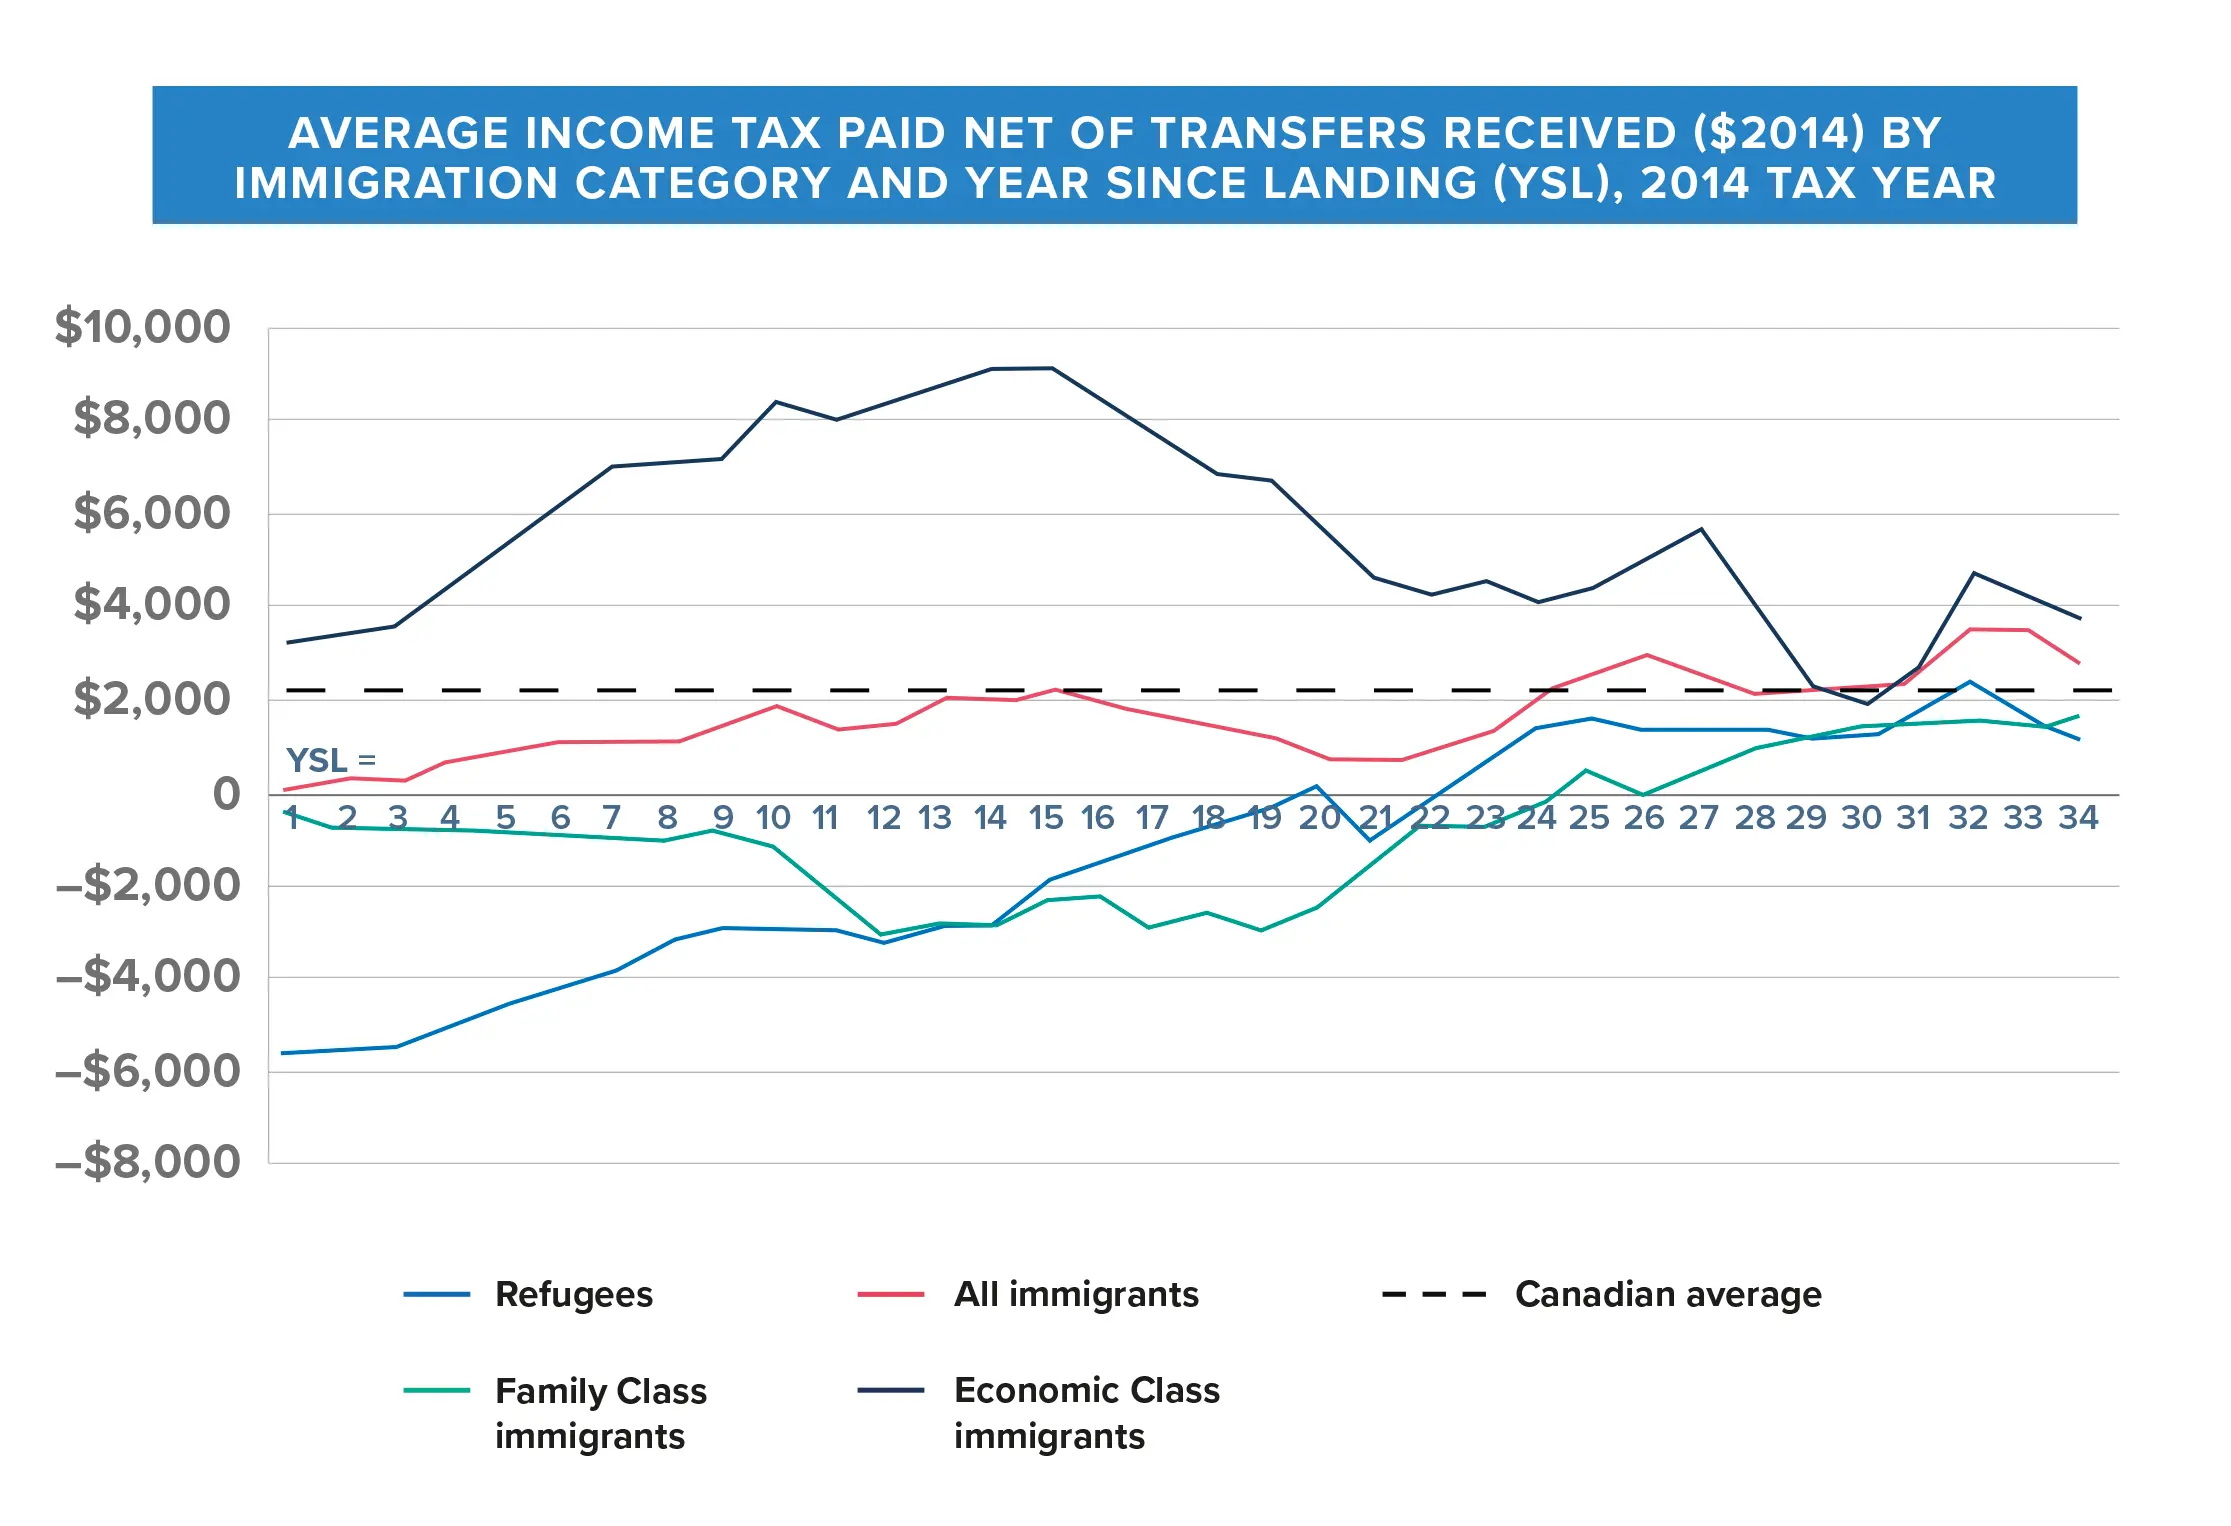
Canada’s investment in refugees pays off. Over time, refugees pay more in income tax on average than they receive in public benefits and services. However, this does not represent all taxes paid (like sales taxes) since it only includes income tax. Refugees increasingly narrow the gap between income tax paid and public benefits and services received the longer they live in Canadian provinces and territories.
Skill levels
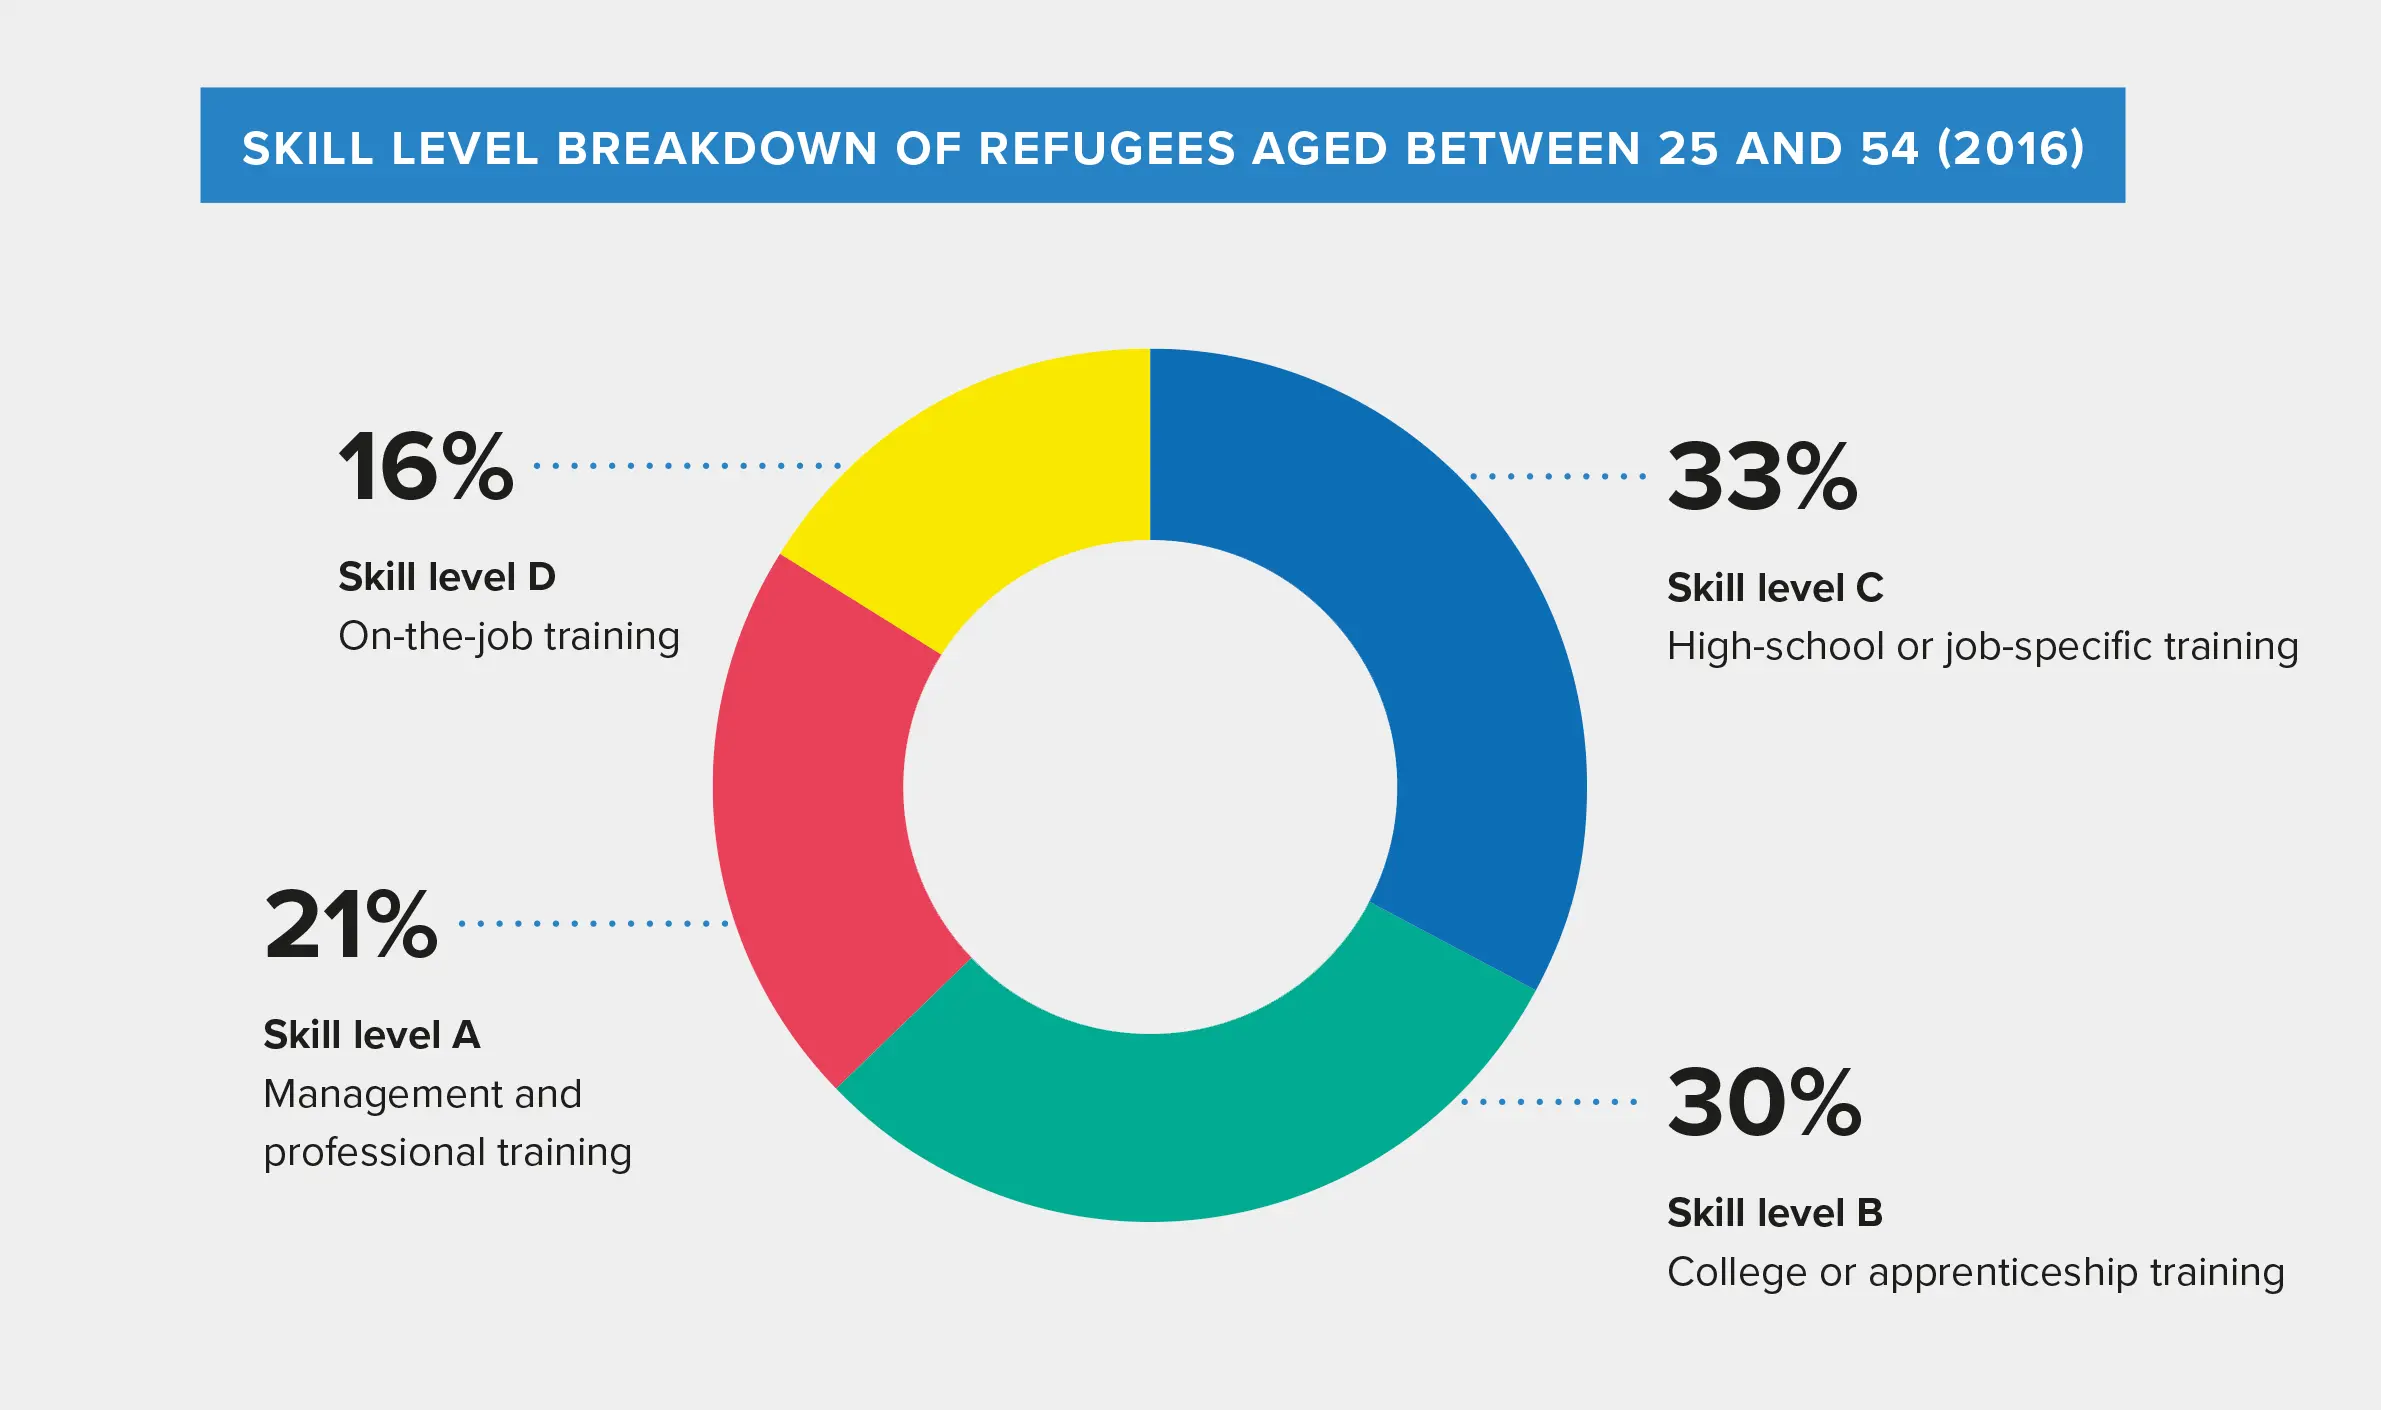
Half of refugees (51%) working are employed in high-skilled jobs, which includes doctors, dentists, architects, service managers and software engineers. In 2016, 33% of refugees worked in jobs that required high school and/or job-specific training (e.g. truck drivers, food and beverage servers, industrial butchers). About one fifth of refugees were employed in professional jobs that required a university degree (e.g. doctors, dentists, architects).
Entrepreneurship
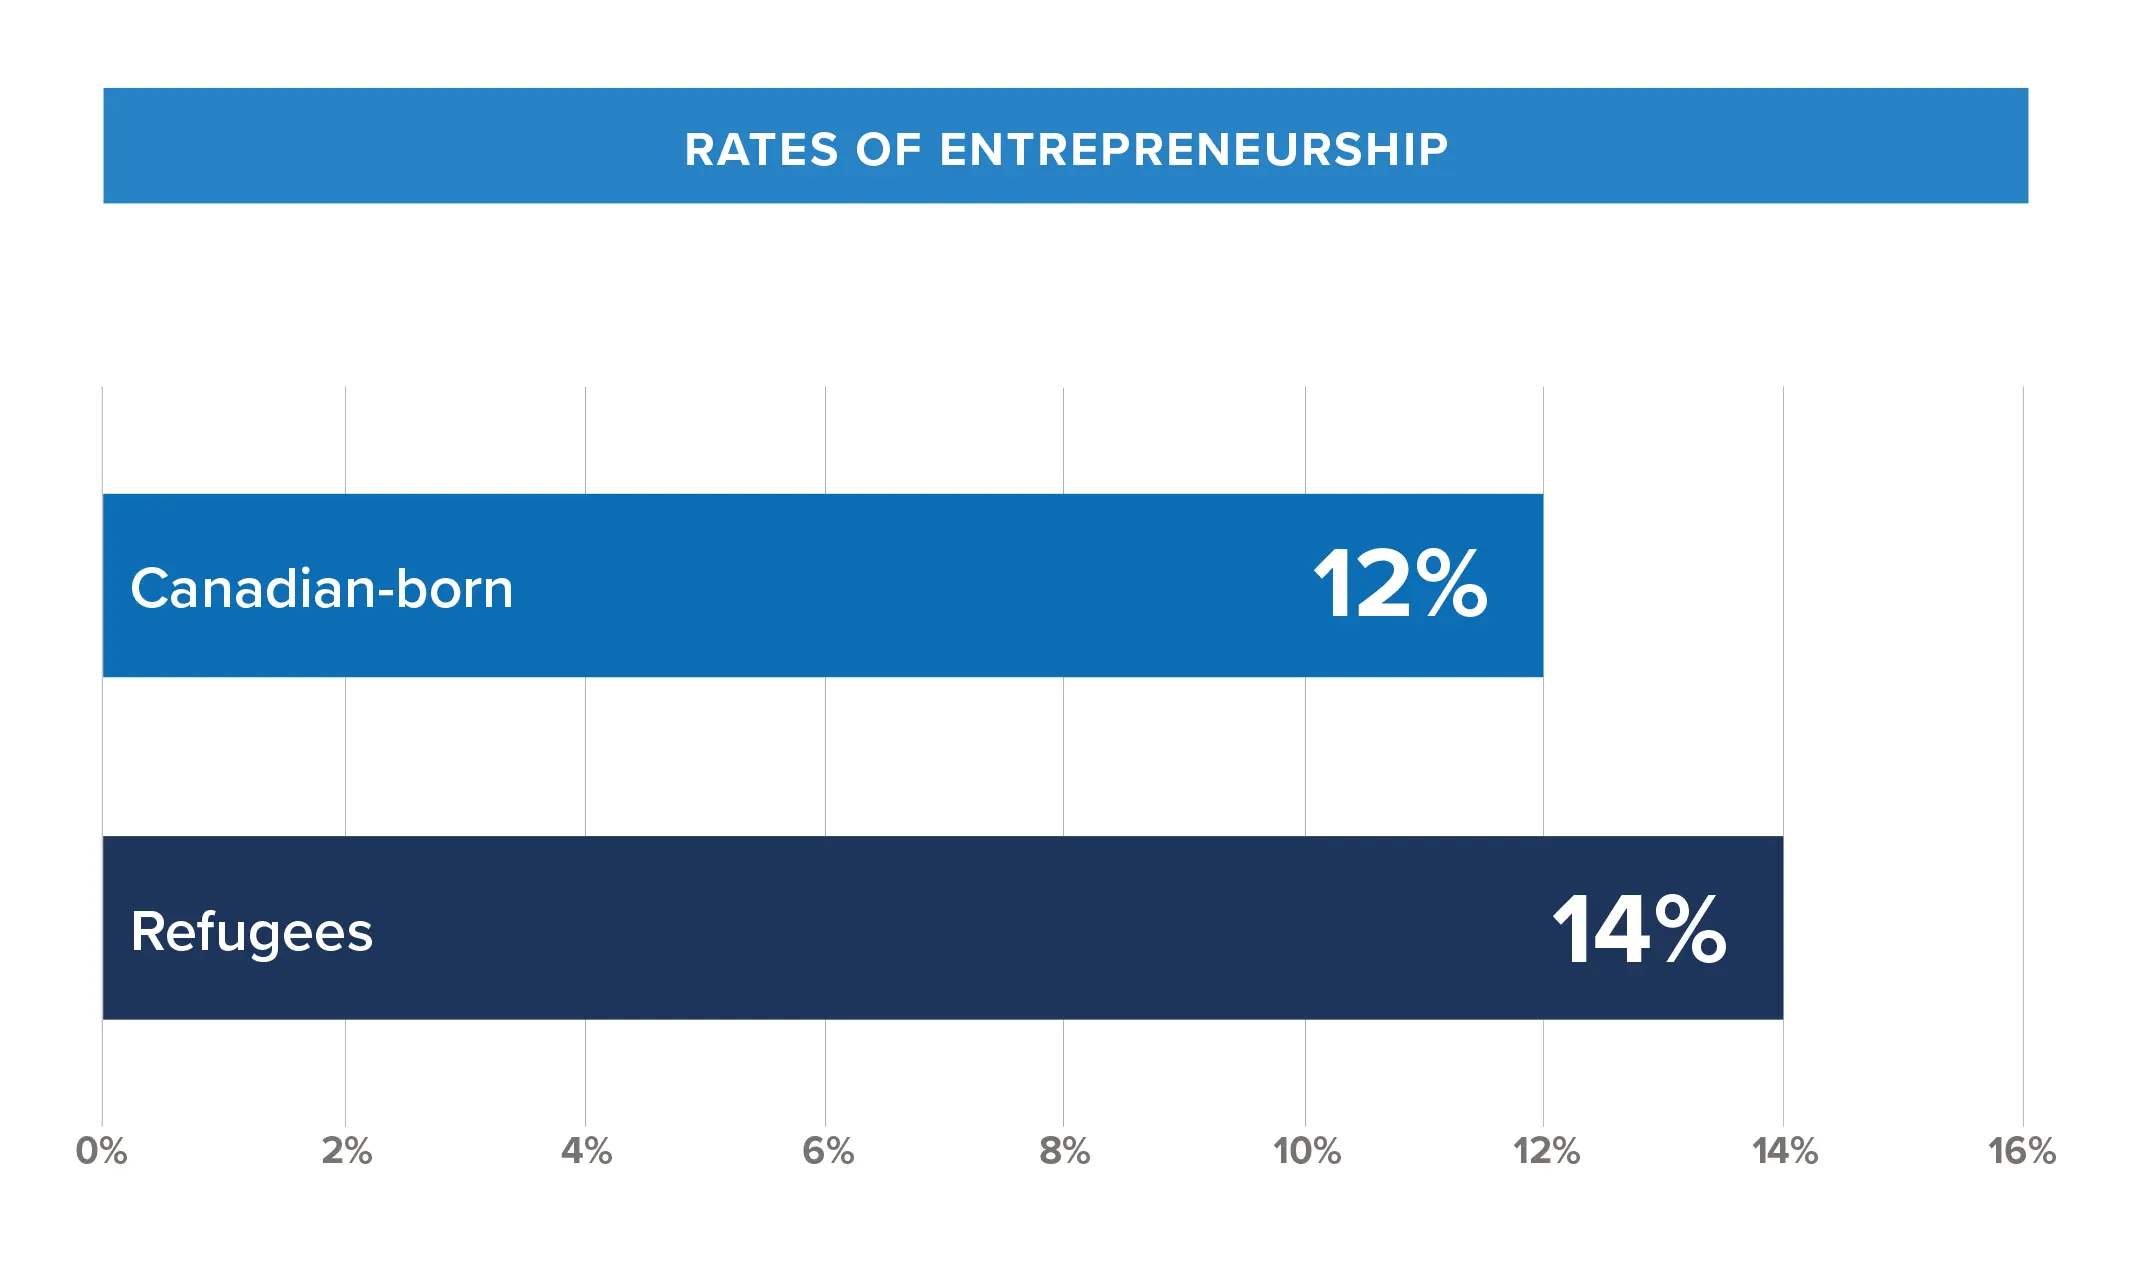
Refugees create jobs for both themselves and other Canadians. Including those who are self-employed and those who own companies, 14.4% of refugees who have been in Canada between 10 and 30 years are entrepreneurs, compared to 12.3% of people born in Canada. Refugees use their diverse skillsets and talents to start businesses and create jobs for themselves and other Canadians.
Aging population
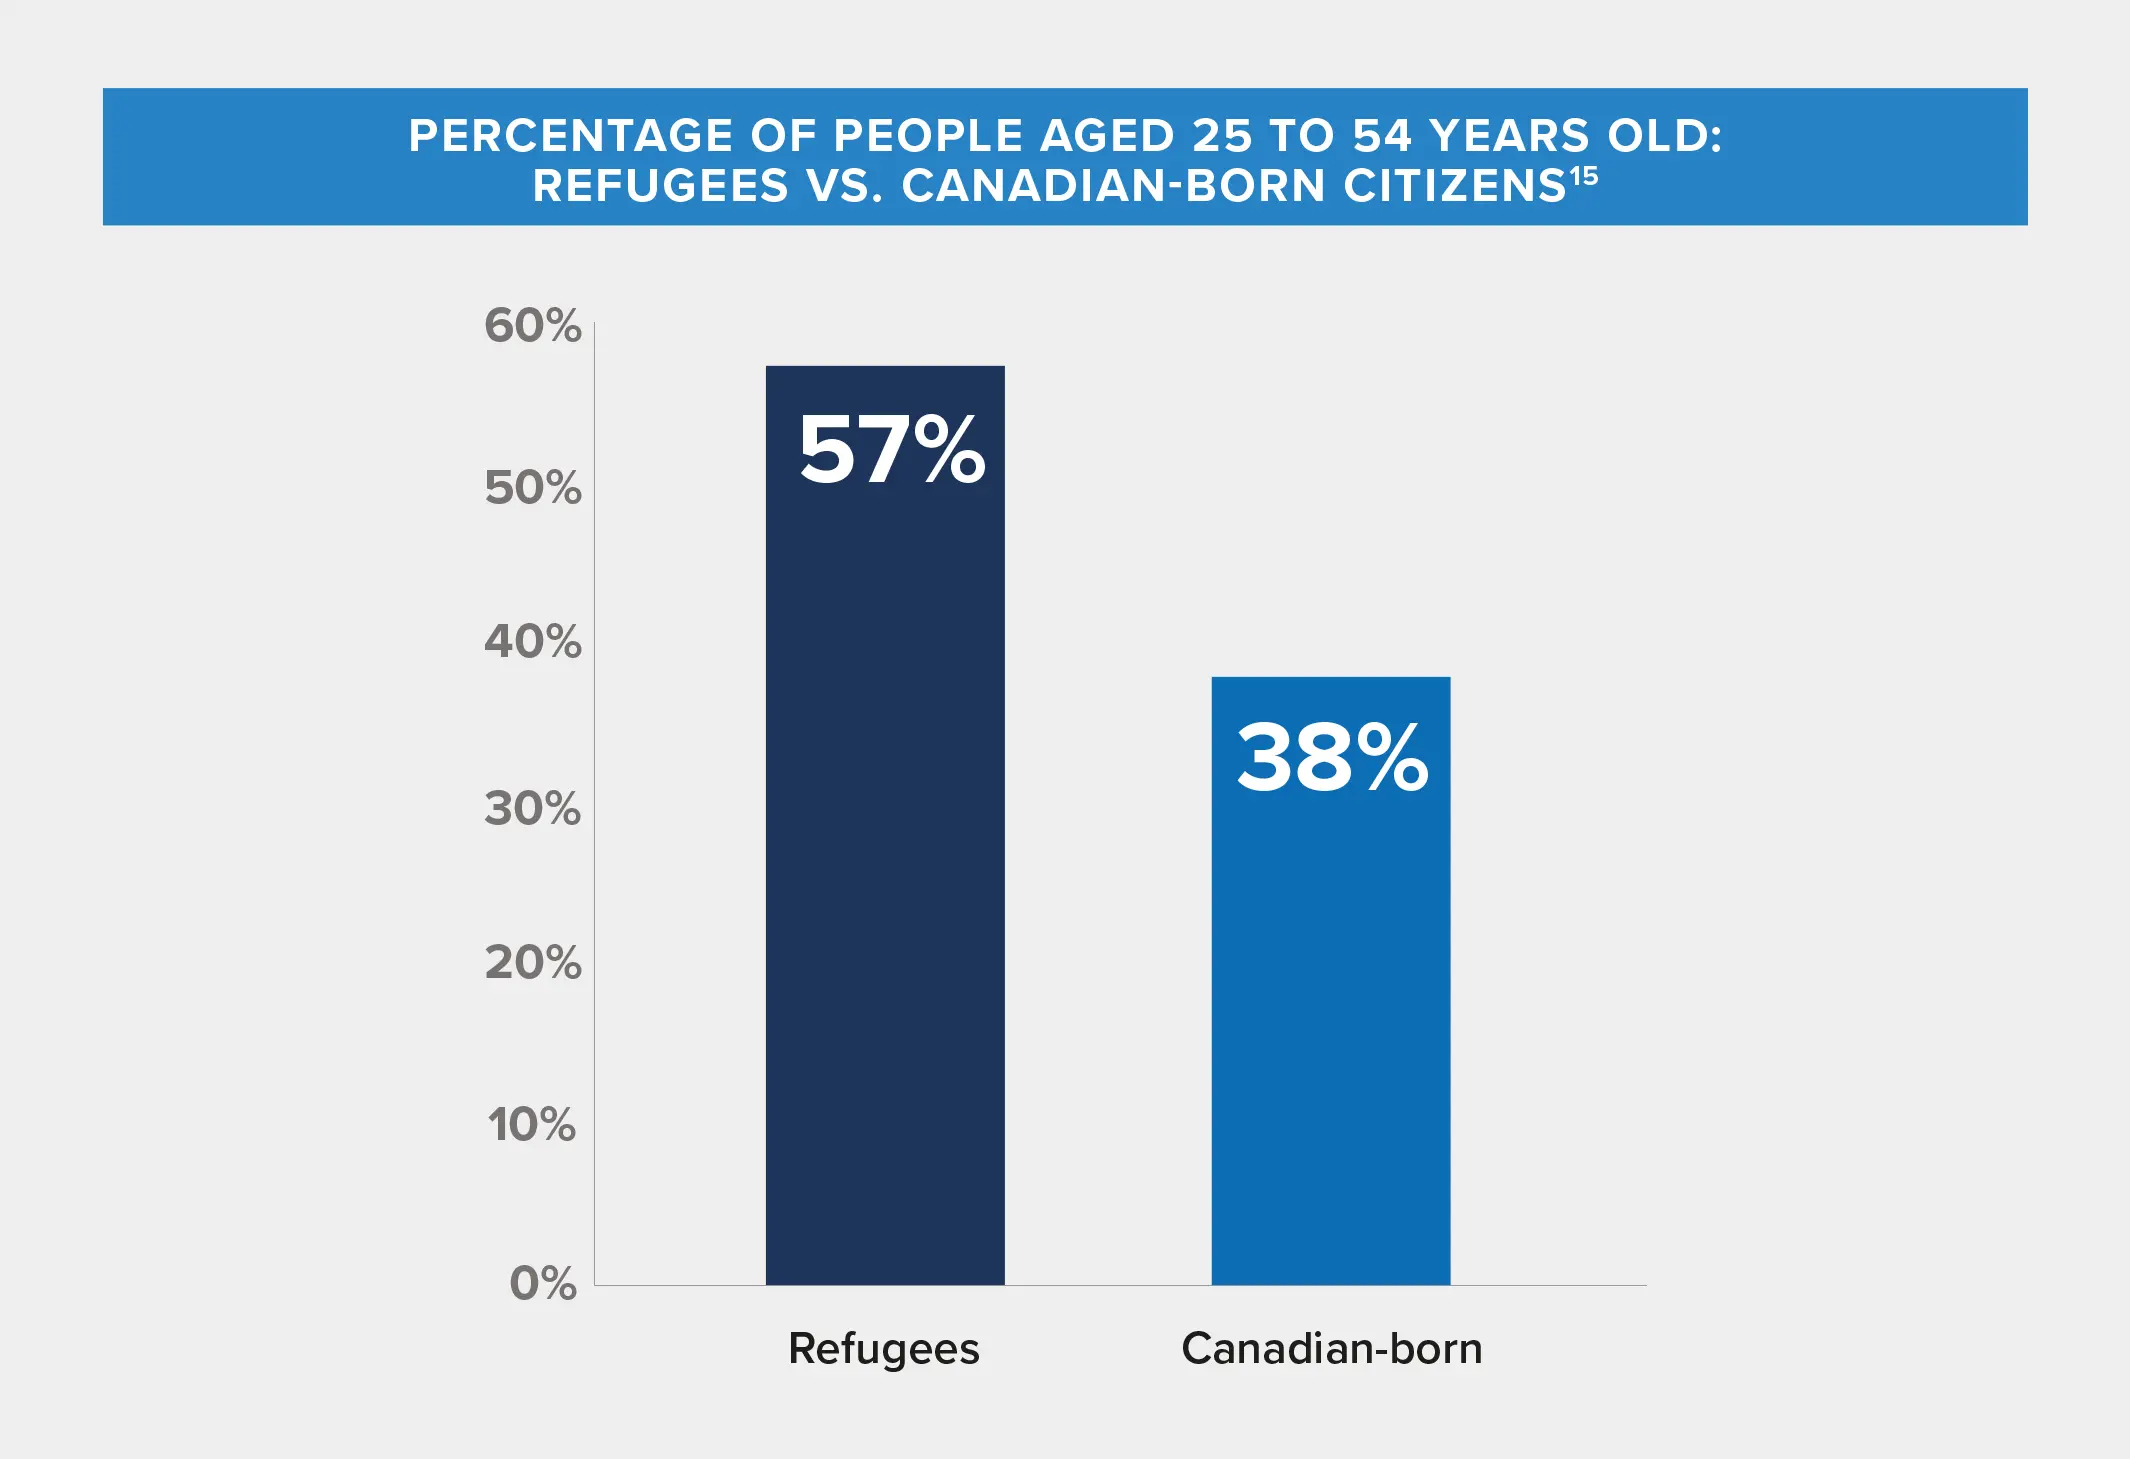
Canada has an aging population, with the average age increasing from 37.7 in 2001 to 41.0 in 2016. Refugees are on average 11.1 years younger than those born in Canada, which means they are more likely to be working age. The average age of a refugee who came to Canada in 2016 was 28.9 years old. Refugees often come to Canada early in their lives, with many years to contribute.
Settling across Canada
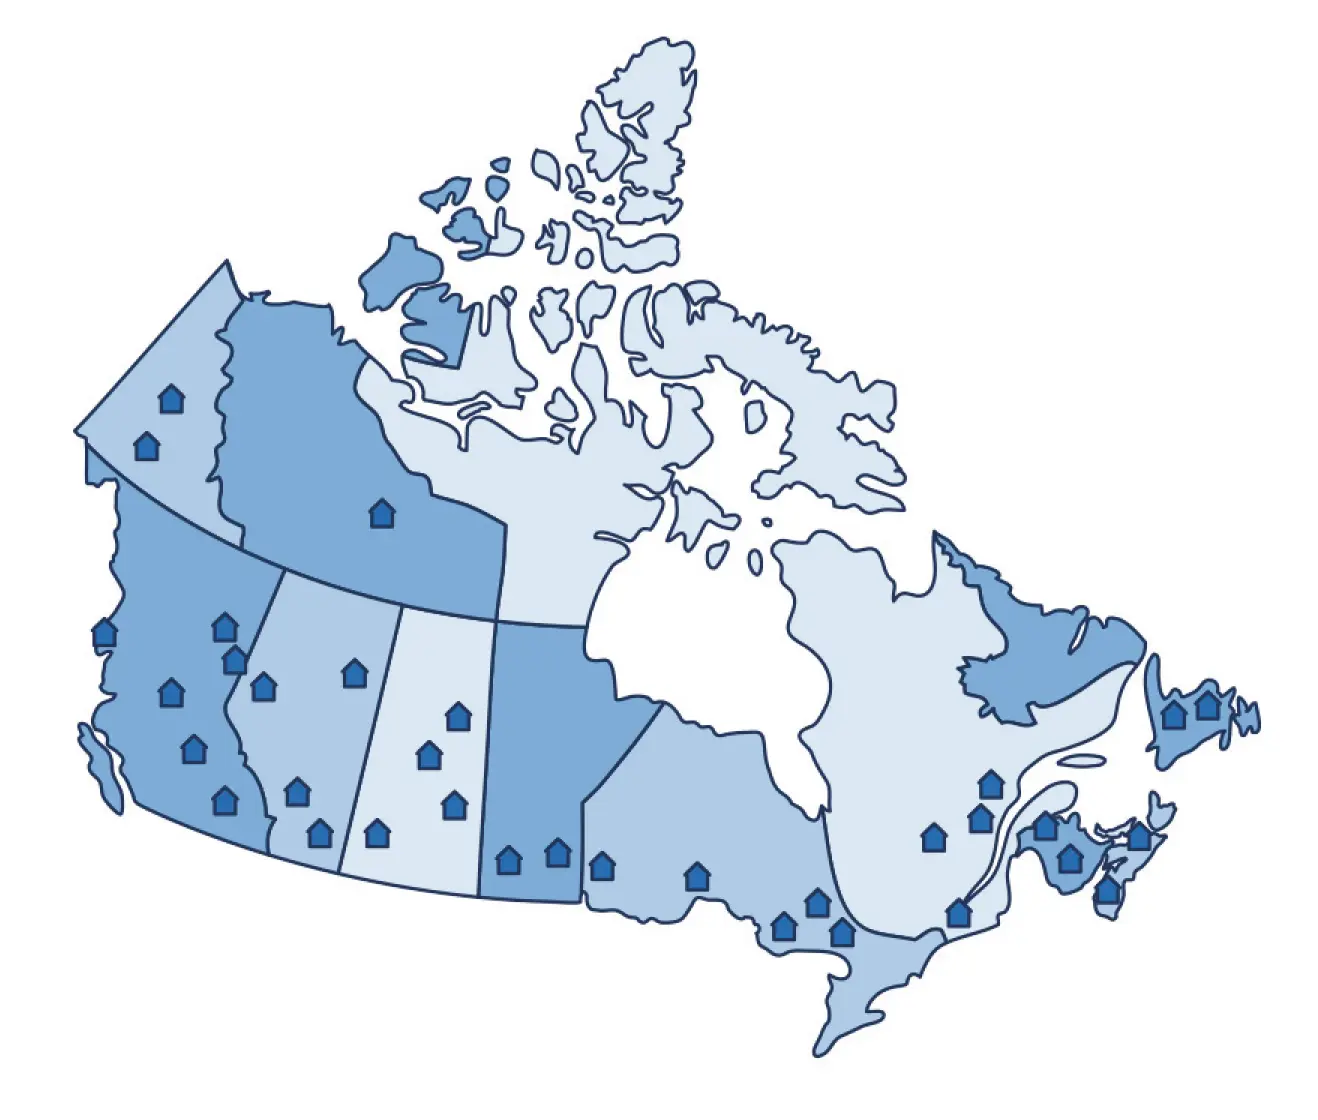
Refugees have resettled in every part of Canada – as far north as Whitehorse, Yukon; as far east as St. John’s, Newfoundland; and as far west as Prince Rupert, British Columbia. Recent census data show that newcomers, led by refugees, are more likely to move to other parts of the country. Of refugees who arrived between 2011 and 2016, 48% live in smaller cities and towns, compared to 44% of all immigrants.
Home ownership
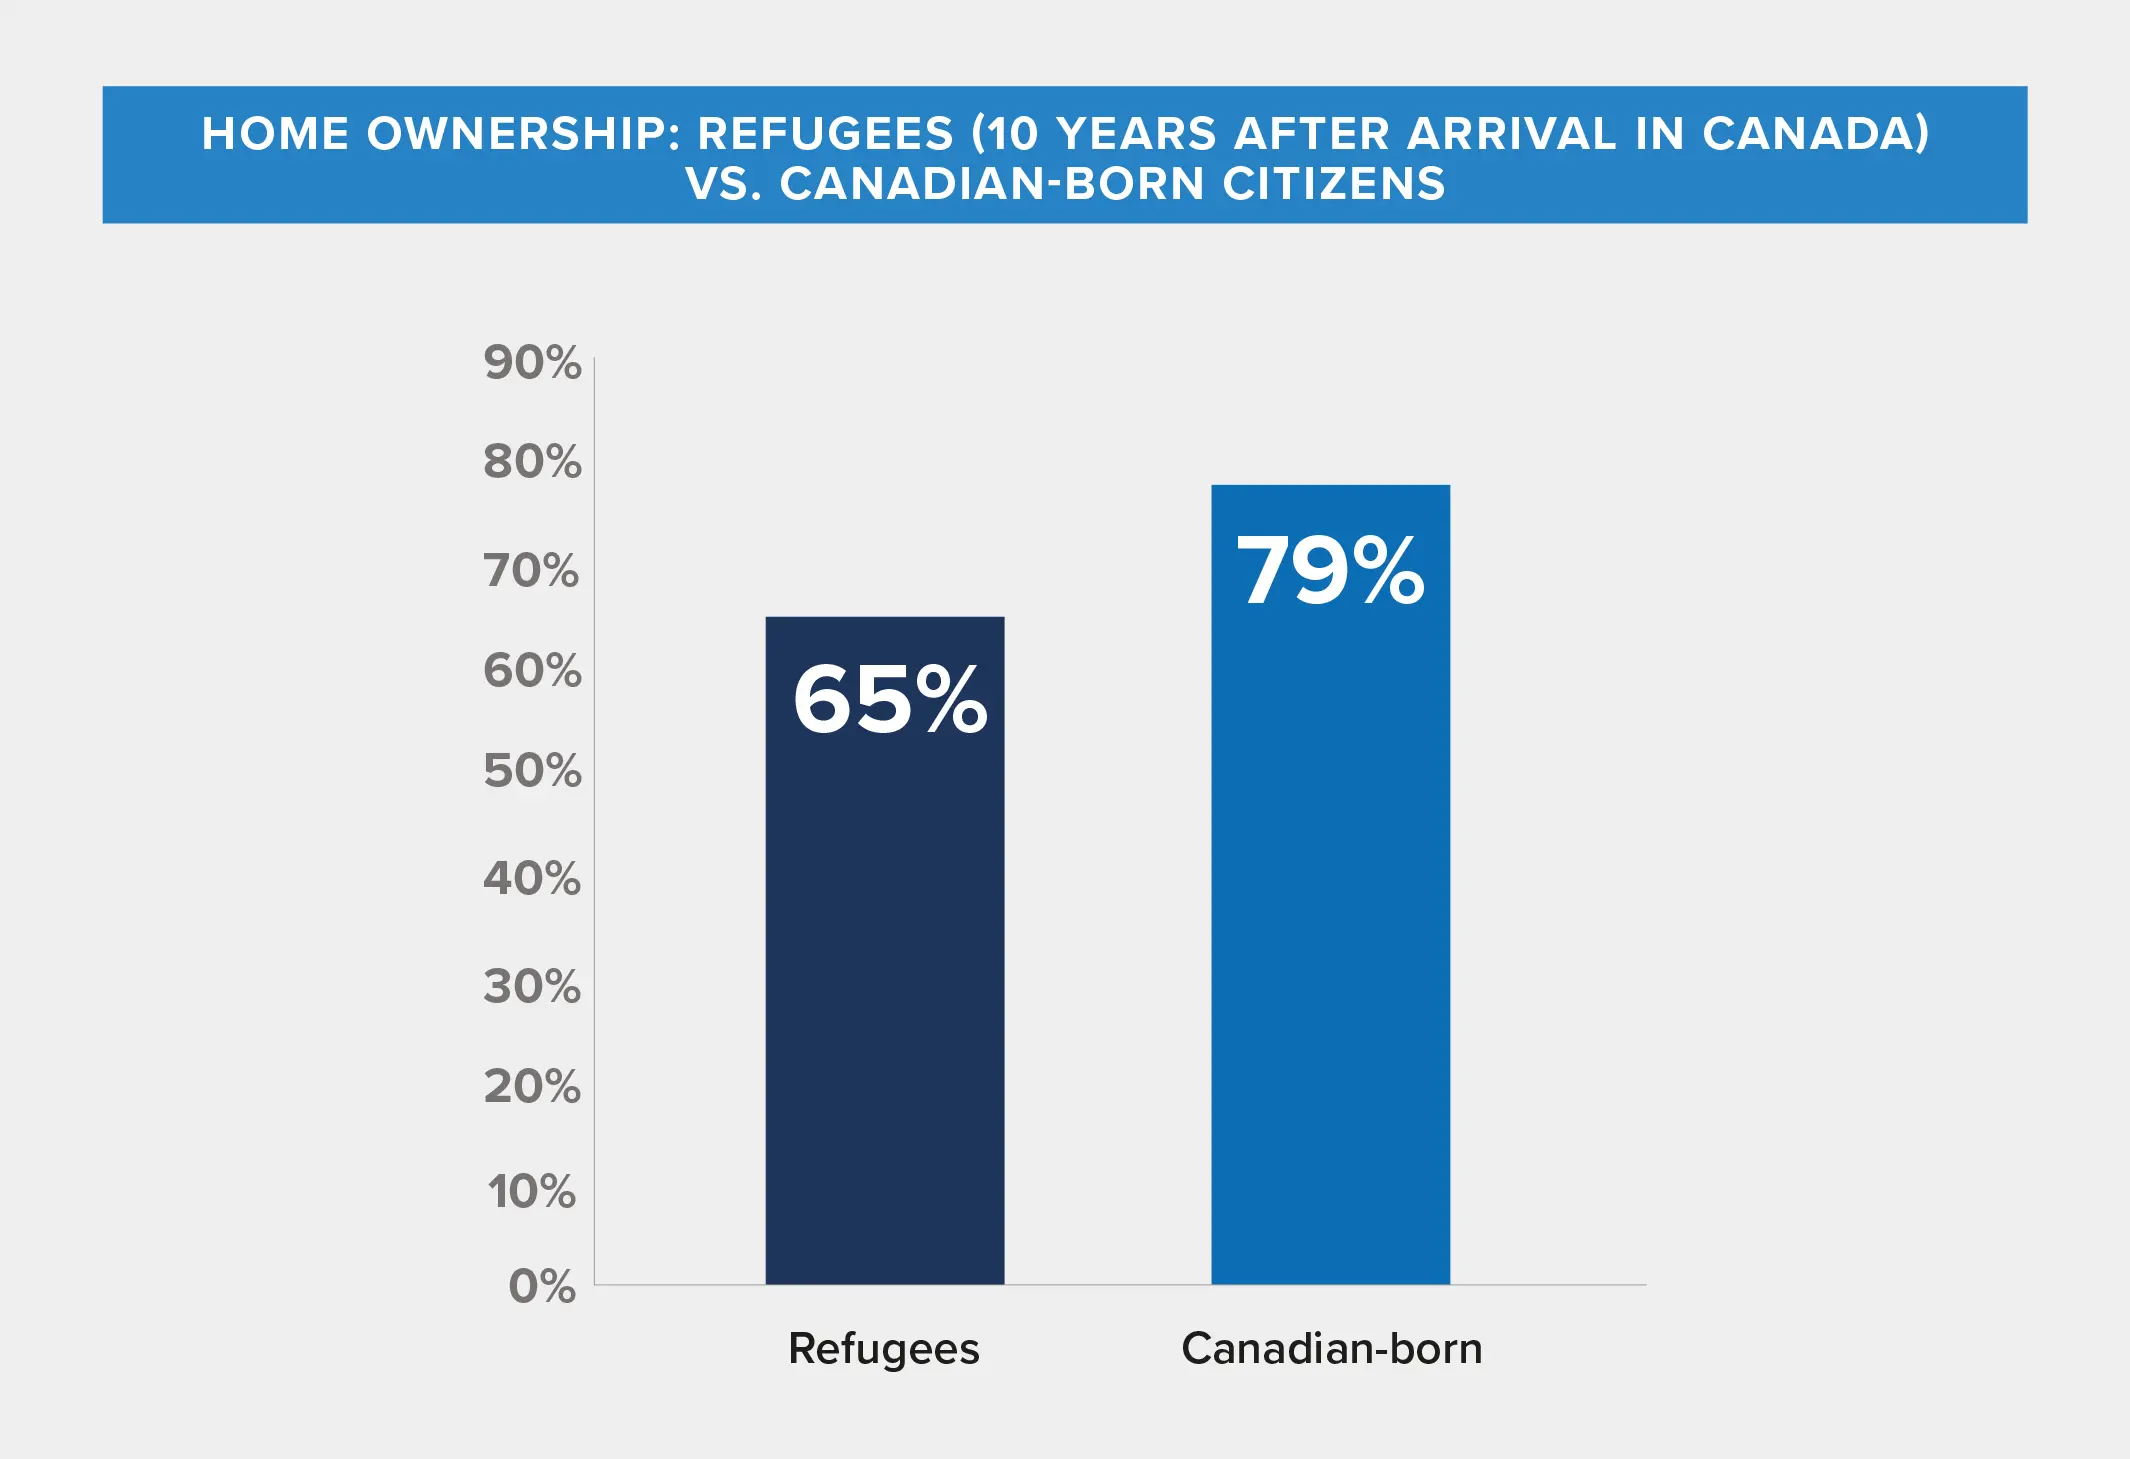
Home ownership is an indicator of a household’s financial health, as well as a family’s commitment to a community. Despite their initial lack of financial resources, 65 per cent of refugee families who have been in Canada for 10 years or more live in homes they own, compared with 79 per cent of Canadian-born citizens. About one-third of refugee families managed to buy their own homes within their first five years in the country.
Sense of belonging
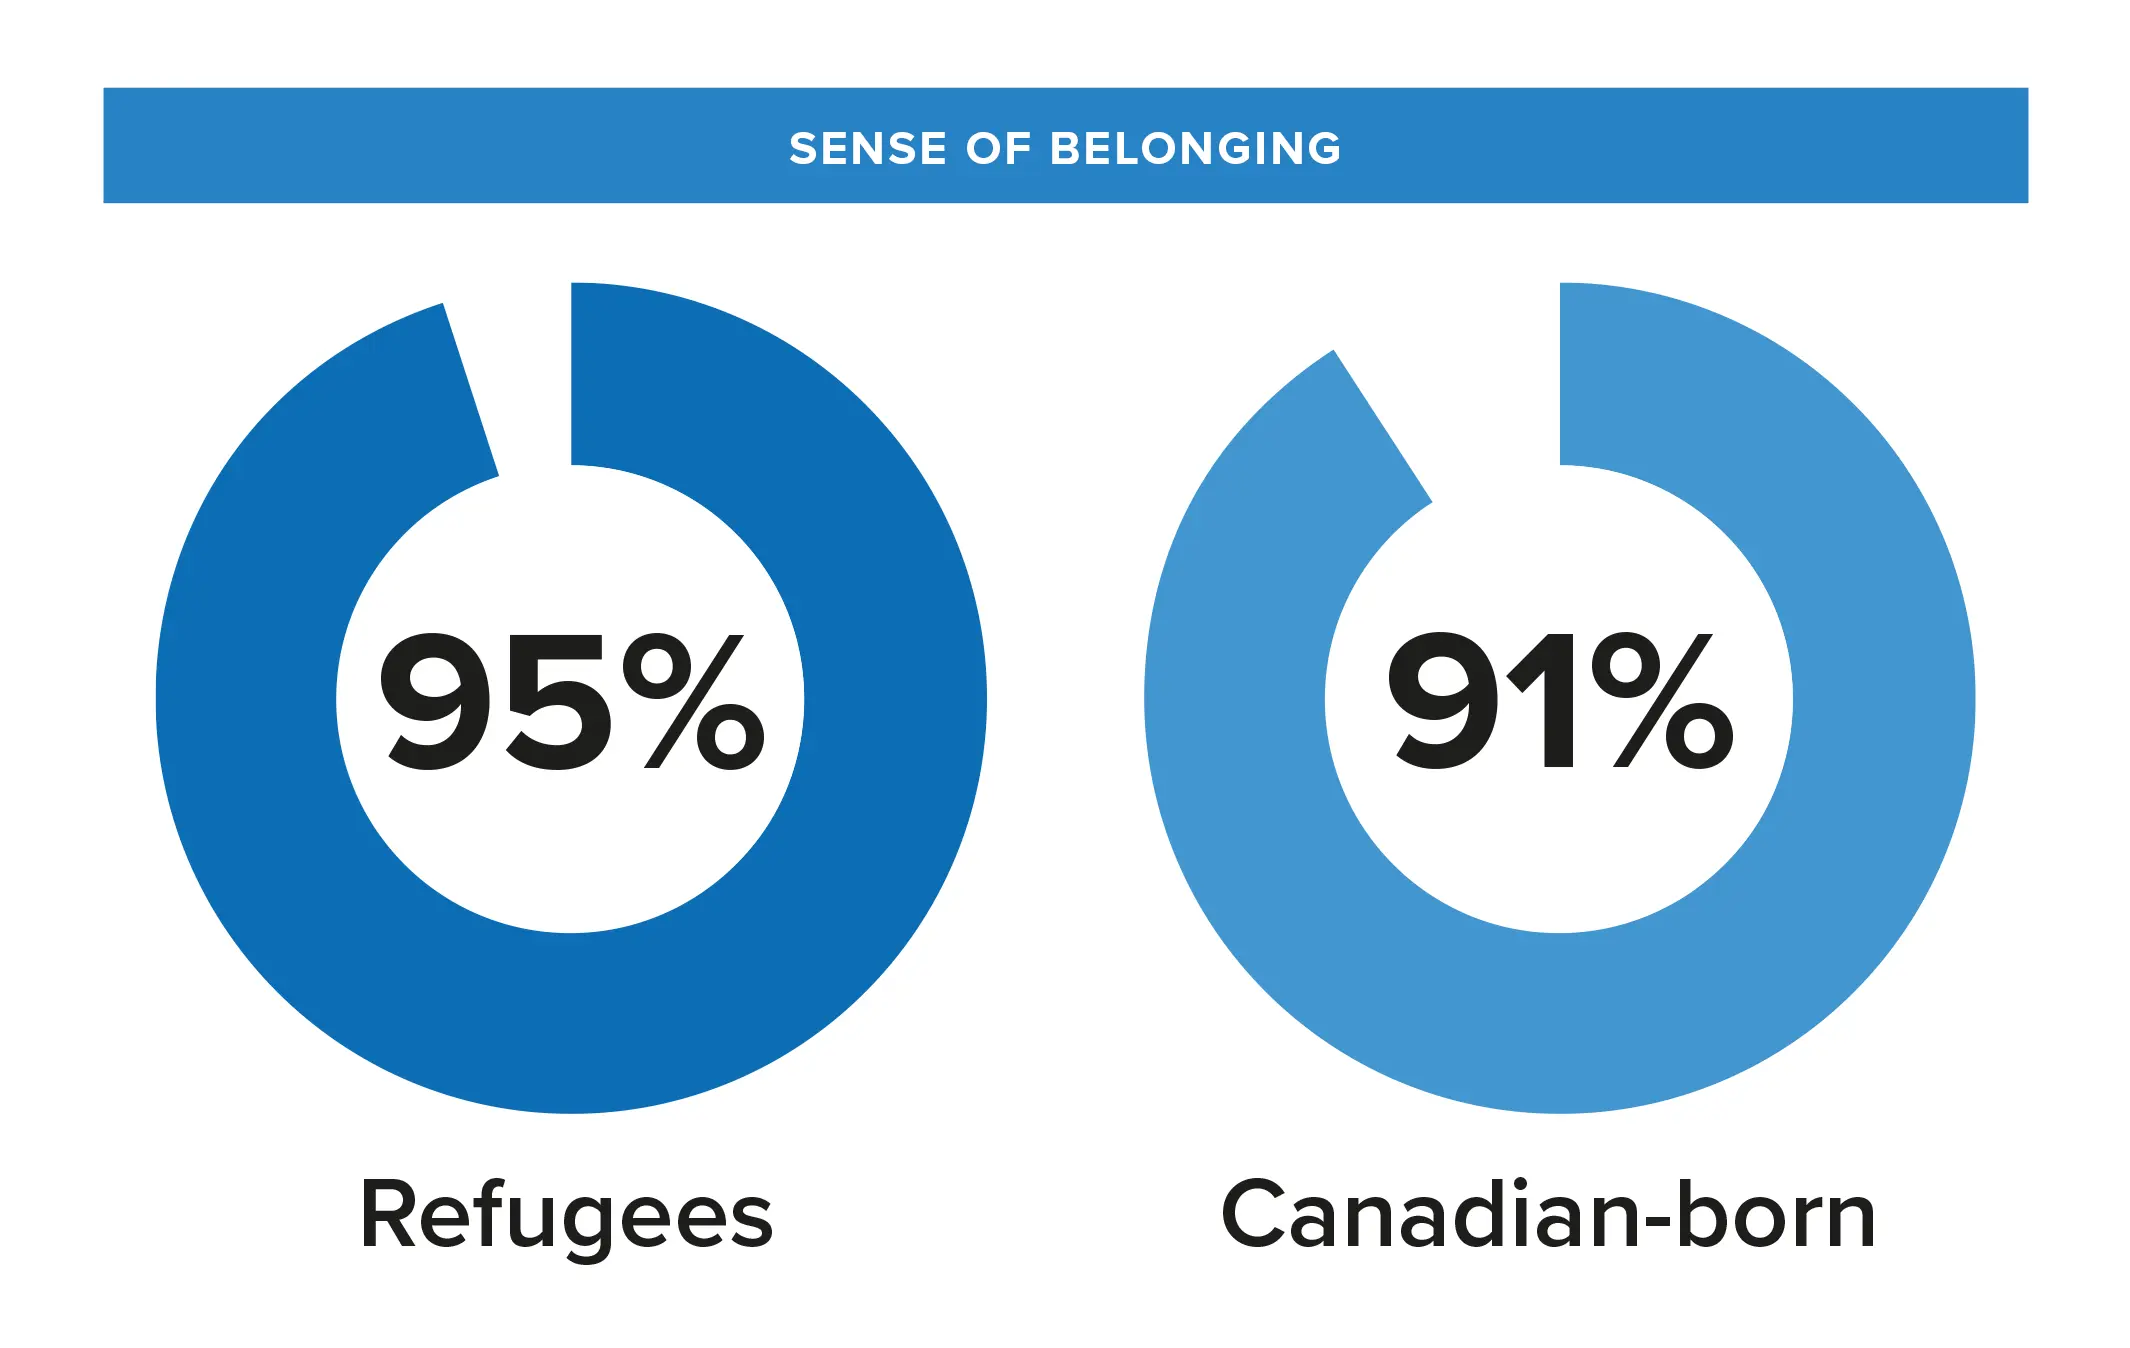
Refugees report a higher sense of belonging to Canada than people born in Canada, with 95% of refugees feeling a “strong” sense of belonging to Canada compared to 91% for the Canadian-born. Refugees’ strong sense of belonging to Canada demonstrates their commitment to integrate into Canadian society and to call this country home.
Citizenship
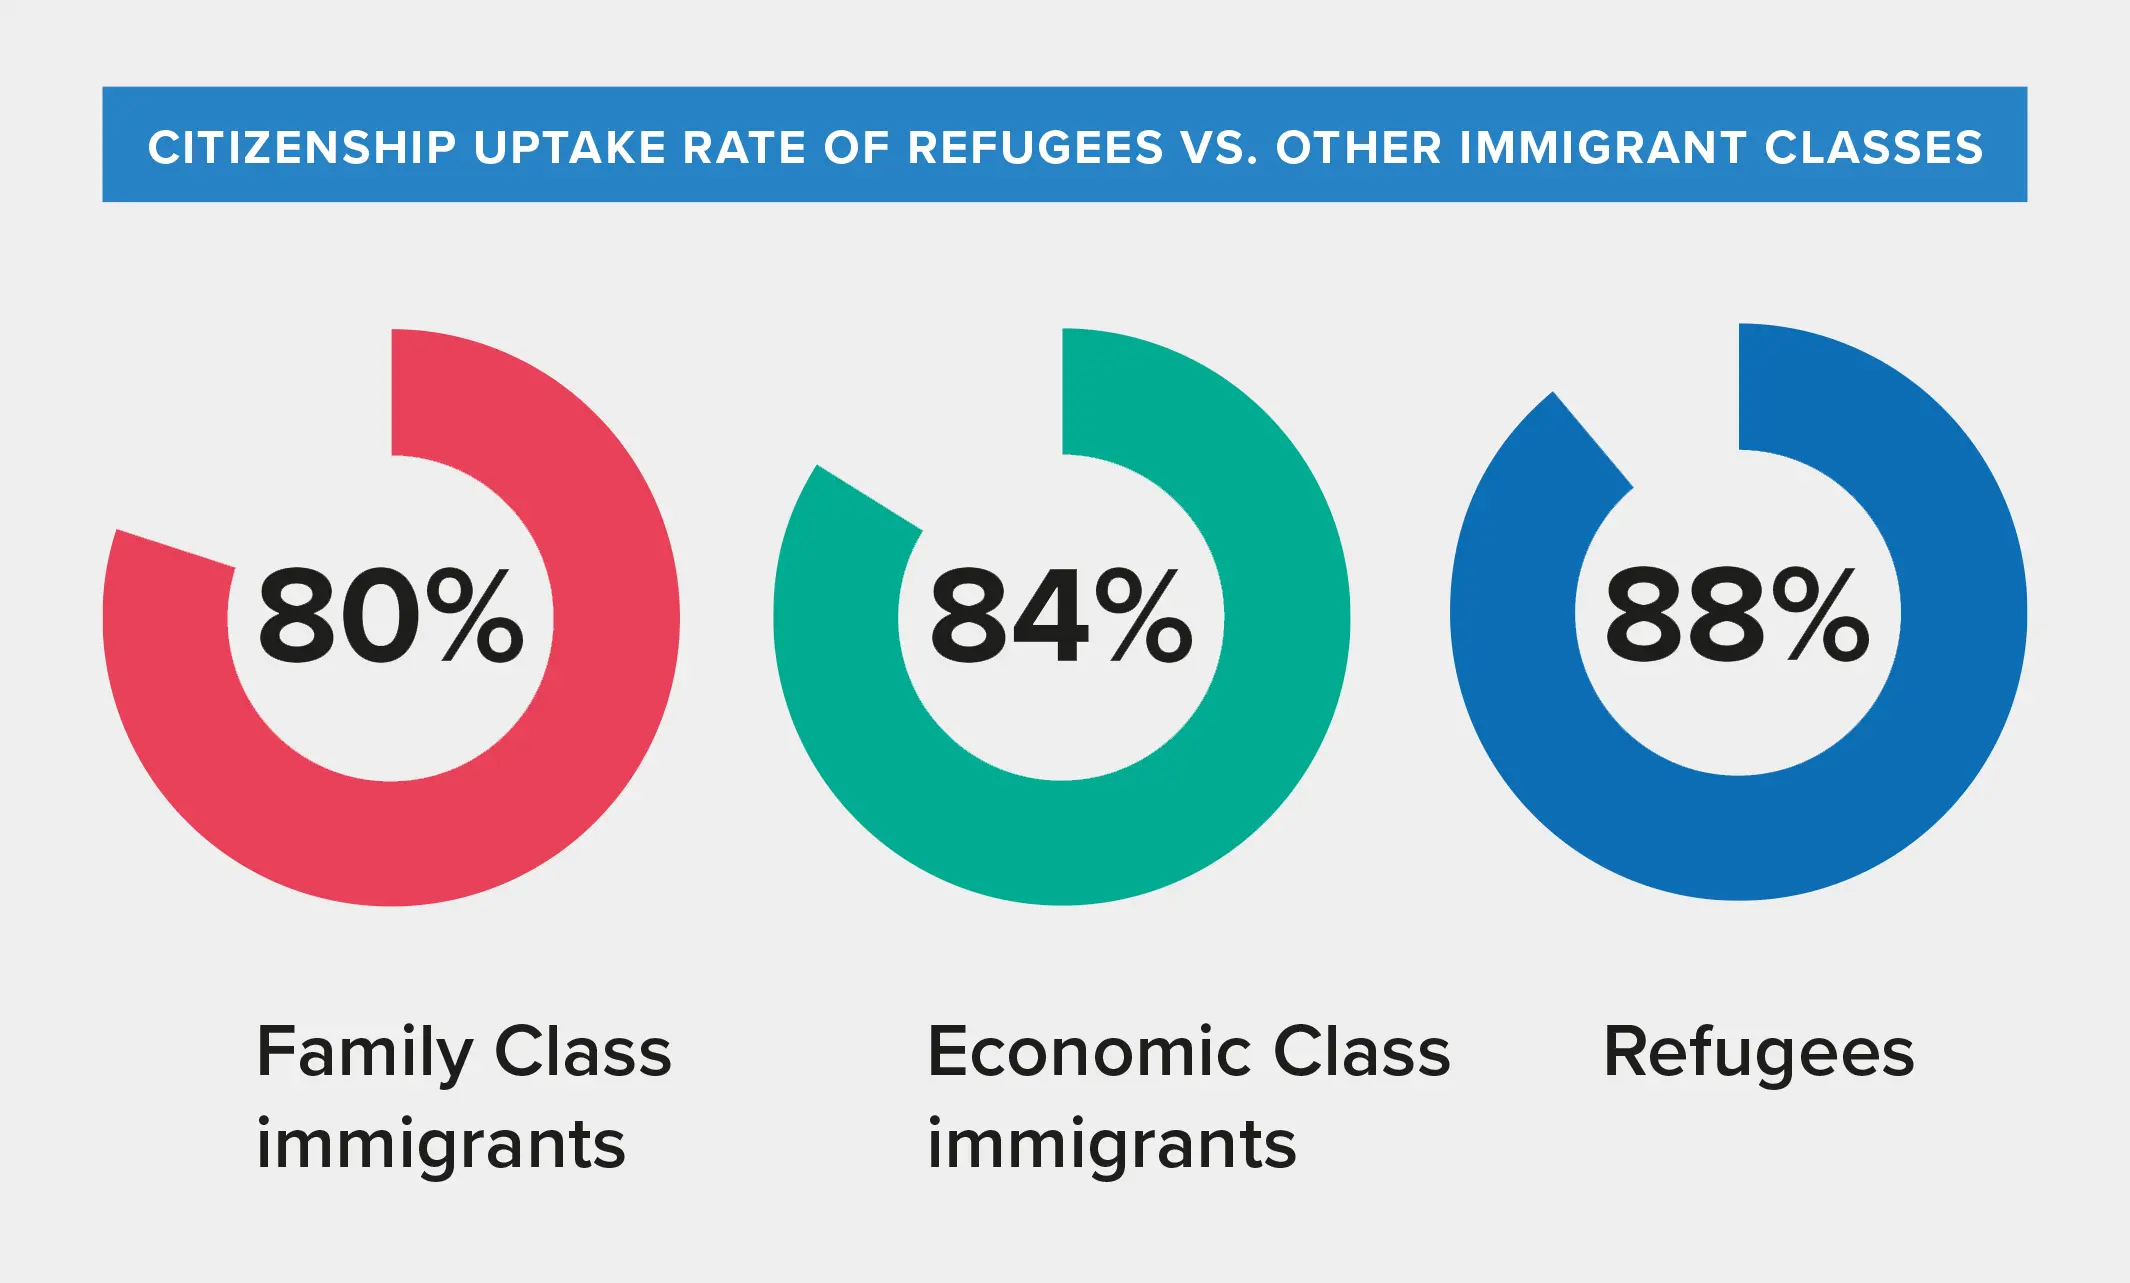
Refugees have the highest citizenship uptake rate of all immigration categories. To become Canadian citizens, refugees must live in the country for at least three years, pay a fee, and pass a test on their knowledge of Canadian history, geography, economy, government, laws and symbols. 89% of refugees become citizens compared to 84% of Economic Class immigrants and 80% of Family Class immigrants.
Education
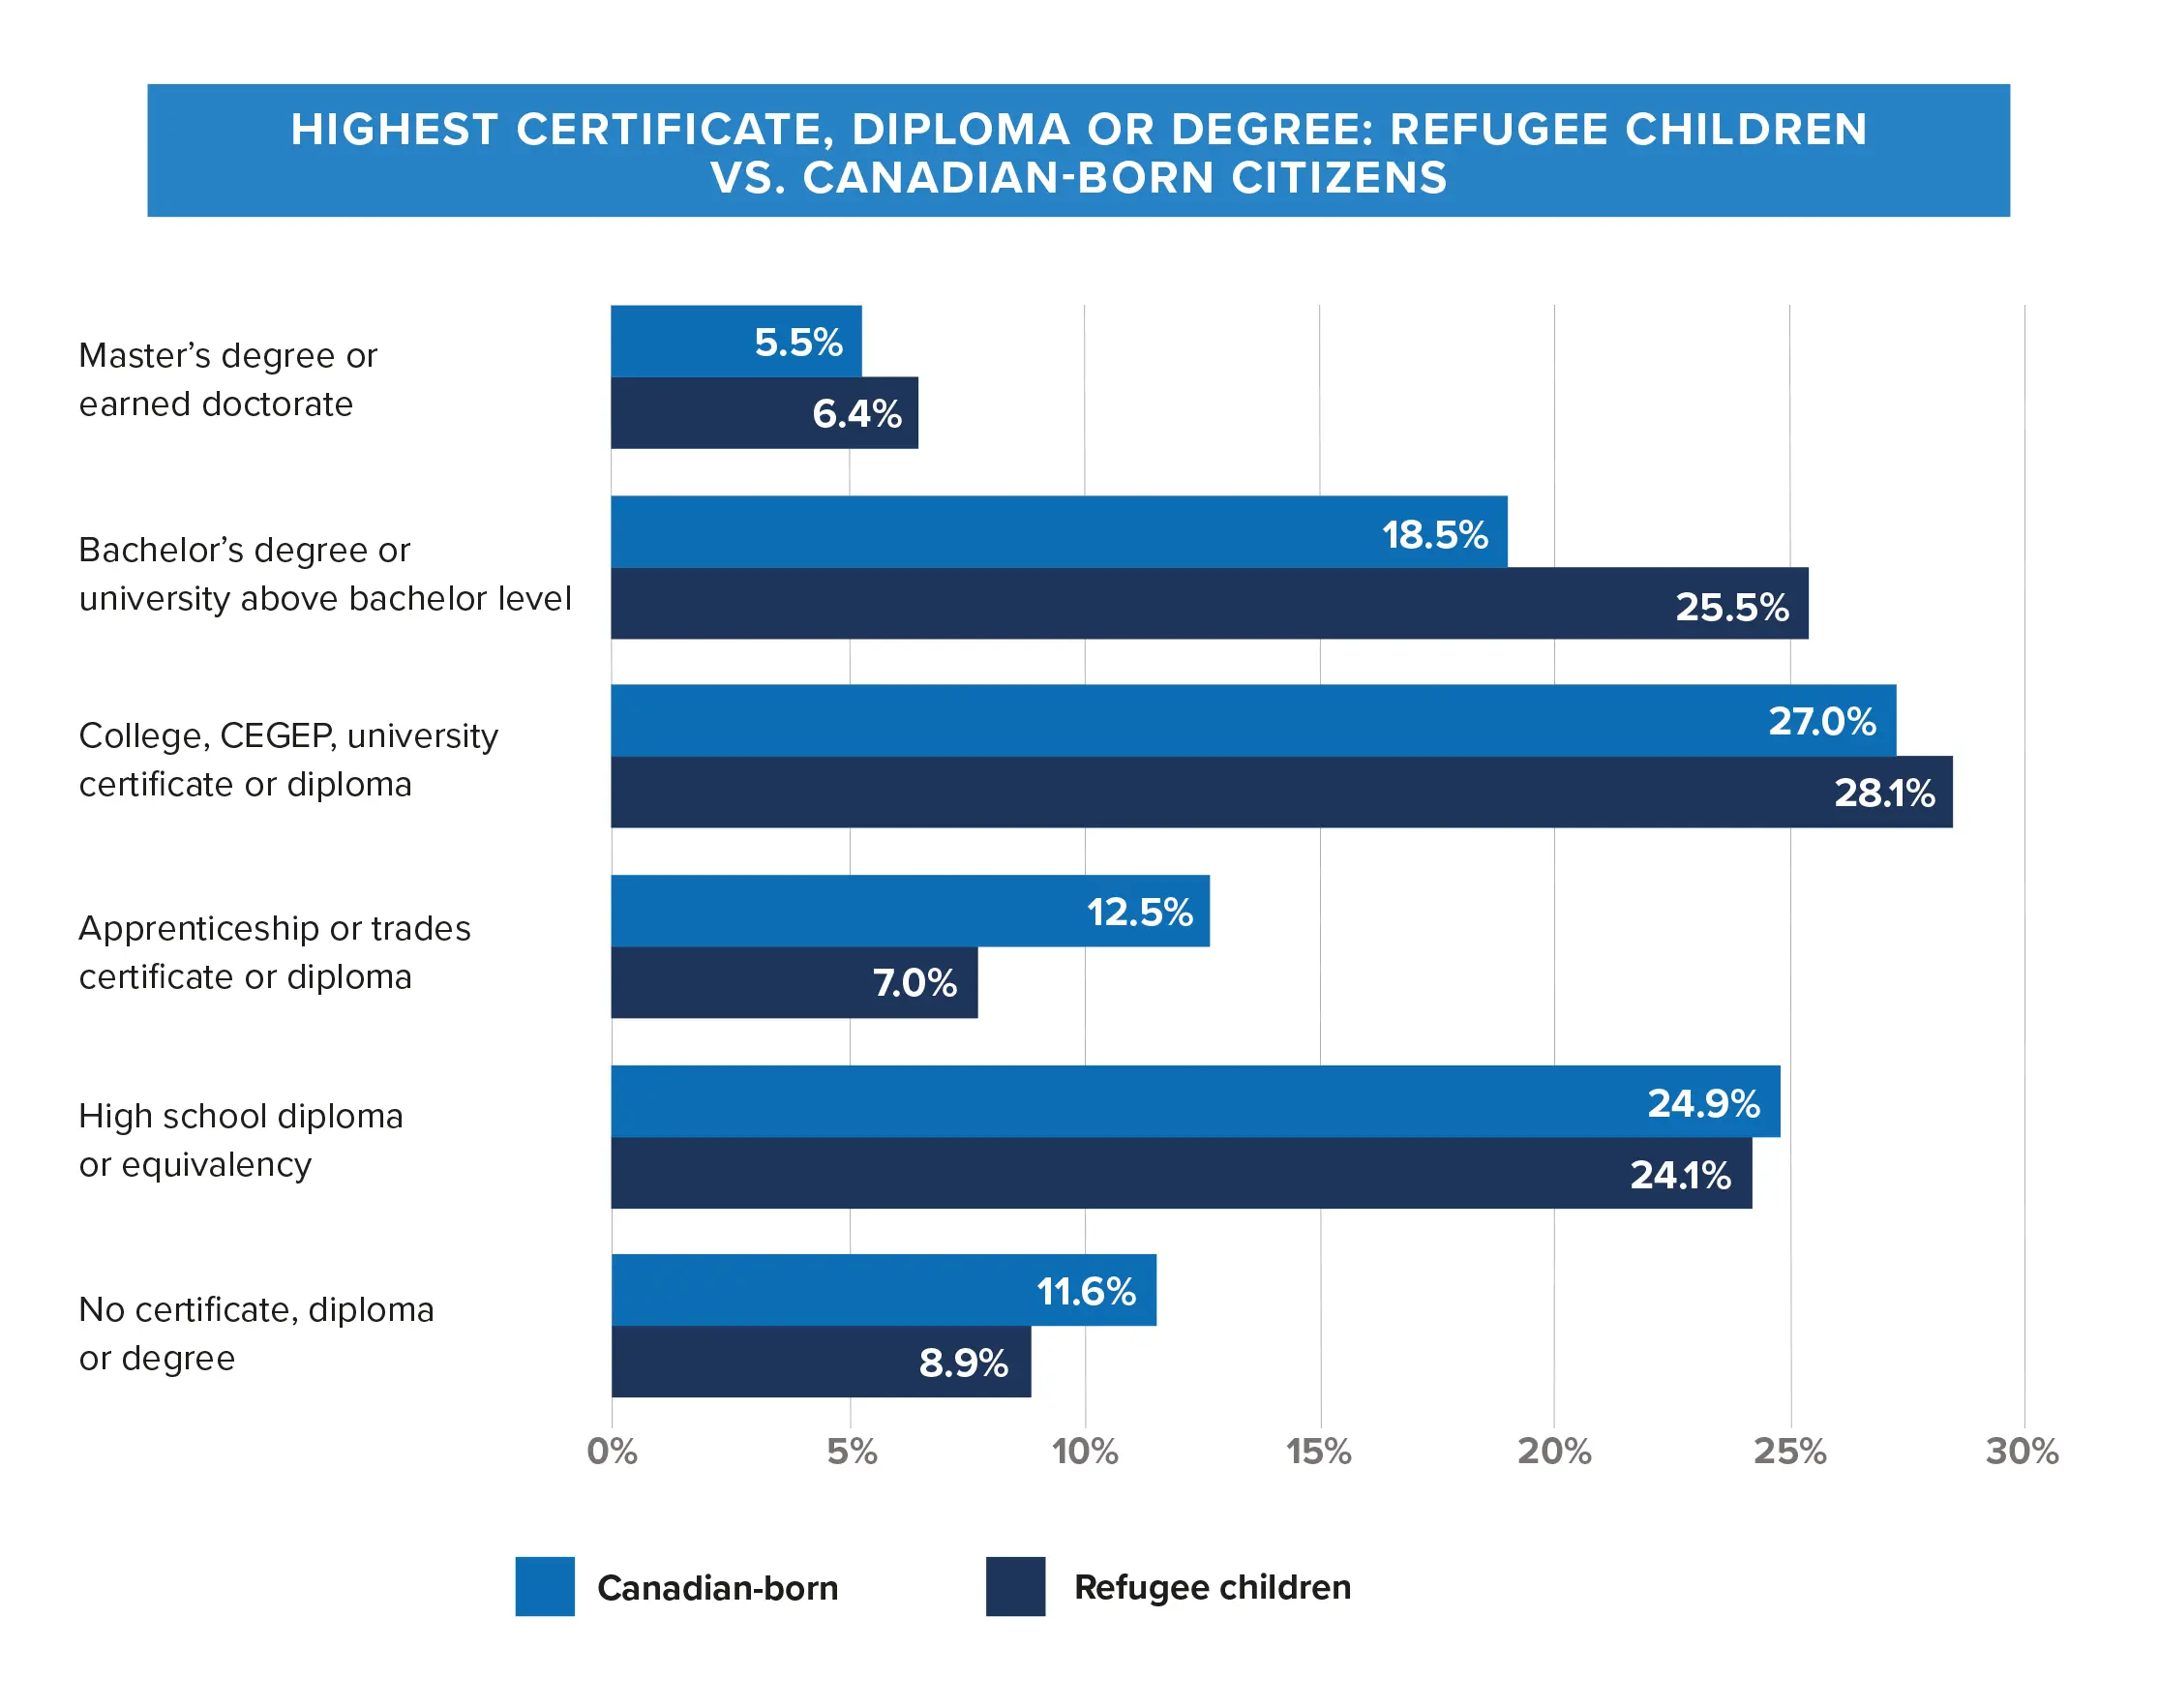
Refugee children perform as well in school as Canadian-born children, and their knowledge and skills contribute greatly to Canada’s workforce. Refugees who arrived in Canada as children have a higher completion rate of high school, college, university and graduate degrees compared to children who were born in the country.
UNHCR is grateful for the assistance of Immigration Refugees and Citizenship Canada’s Research and Evaluation Branch and to Statistics Canada for providing the source data on which much of this section is based. For more information, consult the original document, “Are Refugees Good for Canada? A Look at Canadian Refugee Integration.”
Download a PDF version of our report on the Canadian refugee experience.
Donate Today
Please help refugee families in need.


